How Aireimbursements Predicts the Future of Claim Denials Using Data Science
The RCM meets the Data Science
Gokul Paramanandhan
11/7/20254 min read

Turning Denials into Insights: How Data Analytics Transforms RCM Performance
By AIR (Analytical Intelligence Reimbursement)
In the evolving landscape of healthcare reimbursement, data is both abundant and underleveraged.
Hospitals and clinics continuously generate detailed financial, operational, and clinical datasets — yet most remain trapped in silos, limiting visibility into what truly drives revenue leakage.
At AIR, we believe data should not merely record transactions but reveal intelligence. By combining visual analytics and machine learning, revenue cycle management (RCM) can shift from reactive claim processing to proactive, predictive decision-making.
1. The Hidden Cost of Reactive RCM
Most healthcare organizations operate in a reactive mode — responding to denials, reworking claims, and following up with payers after revenue has already been delayed.
While front-end automation and clearinghouse integrations have improved efficiency, the deeper issues remain embedded in unexamined data patterns.
A study by Change Healthcare found that 90% of claim denials are preventable, yet nearly two-thirds are never reworked. The root cause isn’t always staff performance; it’s visibility.
Without analytics-driven insight, clinics cannot pinpoint where denials originate, which payers delay the most, or how documentation lapses translate into lost collections.
2. From Data to Intelligence: Structuring the RCM Dataset
AIR’s analytical framework begins by reconstructing claim data into three measurable layers:
Claim-Level Attributes: Billed amount, denial reason, CPT grouping, and payment turnaround time.
Payer-Level Metrics: Frequency of denials, payment delay behavior, and average claim value.
Time-Series Trends: Month-over-month movement of denial rates, AR balances, and cash flow fluctuations.
The goal is simple — to convert operational chaos into a structured analytical model.
Using Excel for preprocessing, Power BI for visualization, and Python for statistical modeling and clustering, we isolated actionable variables that directly influence revenue predictability.
3. Visualizing the RCM Story: What the Data Revealed
3.1 Denial Reason Distribution (Pie Chart)
The initial pie chart exposed the fundamental imbalance within the denial structure.
Approximately 40% of all denials were traced back to eligibility verification errors and missing documentation.
These issues, while operationally simple, consumed disproportionate administrative effort.
What this visualization made clear is that not all denials are equal — the majority are process-driven, not payer-driven.
This insight led to a targeted recommendation: investing in front-end eligibility automation and EHR-integrated documentation prompts could eliminate nearly half of recurring denials without additional staff.
3.2 Financial Impact by Denial Code (Bar Chart)
While frequency identifies pain points, impact identifies loss.
The bar chart mapped each denial code against its total dollar value. Interestingly, the most common denial codes were not always the most expensive.
Denials under CO-16 (missing information) and CO-29 (timely filing) ranked among the top in financial weight, despite moderate frequency.
This reframed the priority for AR teams — from chasing high-volume rejections to resolving high-cost denials.
In essence, the visualization shifted strategy from count-based efficiency to value-based recovery.
3.3 Claim Aging Distribution (Histogram)
The histogram revealed the temporal health of the revenue cycle.
While a majority of claims cleared within 45 days, a significant long tail extended beyond 90 days — representing cash flow stagnation.
This finding highlighted a structural inefficiency: certain payer groups consistently delayed remittance despite clean claims.
Rather than treating all AR equally, the insight supported creating a payer-tiered follow-up system — prioritizing high-value delayed claims and automating reminders for predictable lagging payers.
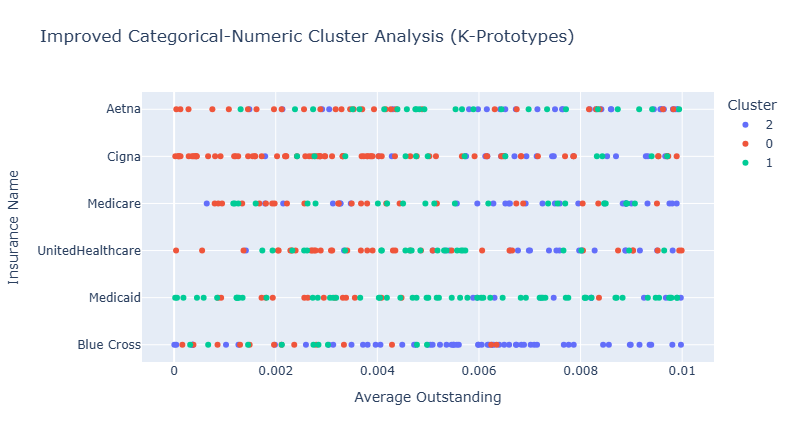
4. Clustering Intelligence: Segmenting Payer Behavior
With descriptive analytics complete, the next phase was pattern recognition.
Using K-prototypes clustering, claims were grouped based on both numerical and categorical attributes — such as denial rate, payment delay, and payer type.
Three distinct behavioral clusters emerged:
Cluster 1: Fast Payers, Low Denials
Reliable entities with consistent payment cycles, often large carriers or government programs. These require minimal follow-up but demand compliance precision.Cluster 2: High Denial Frequency, Moderate Value
Mid-tier payers with frequent rejections due to documentation or coding inconsistencies. Process improvement and coding validation can yield immediate gains.Cluster 3: High-Value, High-Delay Payers
The most financially influential yet operationally challenging segment. While eventual payment is likely, extended remittance cycles distort cash flow.
Predictive follow-up automation and root-cause denial dashboards can recover 10–15% of previously stagnant revenue within this group.
Clustering transforms data from observation to segmentation-based strategy.
Instead of treating denials as isolated events, they become predictable behavioral patterns — allowing clinics to tailor escalation workflows per payer segment.
5. Turning Analytics into Action
Data visualization is only as valuable as the operational change it drives.
At AIR, each visualization was translated into an actionable improvement plan:
RCM StageIdentified IssueAnalytical SolutionBusiness OutcomeFront-EndEligibility and missing documentation errorsAutomated eligibility checks & documentation alerts40% reduction in front-end denialsMid-CycleHigh-value denials (CO-16, CO-29)Root cause tracking dashboard by financial impact12% improvement in net collectionsBack-EndDelayed payments beyond 90 daysPayer-tiered AR prioritization & follow-up automation18% faster AR turnover
This closed-loop process bridges analytics and operations, ensuring that insight converts directly into financial outcomes.
6. The Strategic Value: From Reactive to Predictive RCM
The broader shift enabled by analytics is philosophical as much as technical.
Reactive RCM teams respond to issues; predictive RCM teams anticipate them.
By establishing continuous monitoring dashboards and integrating cluster-based alerts, AIR enables clients to forecast where denials will likely occur — and intervene before they materialize.
The transformation can be summarized in three progressive stages:
Descriptive: Understanding what happened (e.g., top denial codes, AR distribution).
Diagnostic: Knowing why it happened (e.g., eligibility errors, payer behavior).
Predictive: Anticipating future risks (e.g., which claims are likely to be delayed).
Organizations that evolve through these layers transition from firefighting to foresight — building resilience into their reimbursement cycle.
7. Case Insight: From Visualization to Impact
One mid-sized specialty clinic in Texas implemented AIR’s visual analytics model across its billing data.
Within three months:
Eligibility denials dropped from 21% to 9%.
AR days decreased by 14 days on average.
Net collections improved by 11%, without additional billing staff.
The change was not driven by new software, but by new visibility.
By transforming their static claim reports into actionable analytics, the clinic turned every denial into a data point — and every data point into a revenue decision.
8. Conclusion
Data is no longer a byproduct of healthcare operations; it is the operating system itself.
For clinics and billing companies navigating shrinking margins and payer complexities, analytical intelligence offers the next competitive edge.
At AIR (Analytical Intelligence Reimbursement), our mission is to decode the revenue cycle through data — helping providers see beyond the numbers, uncover hidden inefficiencies, and recover lost revenue with precision.
When analytics meets reimbursement strategy, the outcome is not just optimization — it’s transformation.
To see the full report: https://shorturl.at/A8O9w
Help
Questions? Reach out anytime.
Contact
Connect
+91-7418551160
© 2025. All rights reserved.
Ai.Reimbursements@outlook.com